
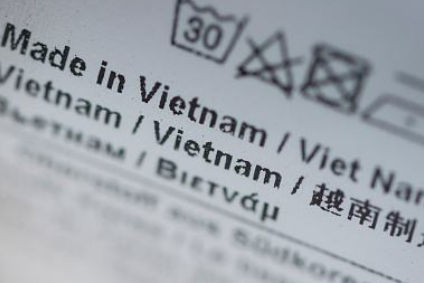
Vietnam made it onto the list of the world’s top ten textile exporters for the first time last year, as new figures show textile and garment shipments from the leading supplier countries fell on declining demand.
The value of global textile and apparel exports from the top ten supplier countries amounted to US$246bn and $384bn, respectively in 2016, according to the World Trade Organization’s (WTO) recently released ‘World Trade Statistical Review 2017′. This is down by $22bn and $3bn, respectively, on the year prior.
Go deeper with GlobalData

Discover B2B Marketing That Performs
Combine business intelligence and editorial excellence to reach engaged professionals across 36 leading media platforms.
Unsurprisingly, China remained the top exporter of textiles in 2016, despite a decline of 3%, with a value of $106bn and a 37% share of world exports. The European Union (EU) was the second largest supplier of textiles with a 23% share and a 1% increase in exports to $65bn. India followed with a 6% share, and despite a 6% decline to $16bn.
The US was the world’s fourth-largest supplier of textiles, despite a 5% decline, with a value of $13bn. While Pakistan moved up two places to reach seventh position with a 9% increase to $9bn. Vietnam entered the top ten for the first time with a 2% share of the world market, and a 9% increase in value to $7bn.
More than half of the top ten textile exporters recorded a decline in the value of their exports in 2016, with the highest drop of 13% seen by Hong Kong, followed by Taiwan by 8%, South Korea by 6%, the US by 5% and China by 3%.
Apparel exports, meanwhile, remained relatively unchanged for the top ten suppliers in 2016, aside from Hong Kong falling one place to sixth position and India rising one place to fifth.
Again, China retained its top spot, representing 36% of world clothing exports in value, but saw its clothing exports fall by 7% to $161bn. EU exports increased by 4% to $119bn, representing a market share of 26%. The highest increases were recorded by Cambodia and Bangladesh, at 6% for both and values of $6bn and $28bn, respectively. While Hong Kong recorded the largest decline of 15%.
Clothing and textiles together represented around 5% of world merchandise exports in 2016, which increased in value by around 32% to reach $16trn.
But while this is good news for the global economy, in volume terms world merchandise trade recorded its lowest growth since the financial crisis of 2008, edging up just 1.3%. This is half the level achieved in 2015 and well below the 4.7% average annual growth rate since 1980.
“The low level of trade growth in 2016 is driven in part by weak GDP growth of just 2.3%, down from 2.7% in 2015 and also below the 2.8% average annual rate since 1980,” the report explains. “There has also been a decline in recent years in the ratio of trade growth to GDP growth, which has fallen to around 1:1 in the wake of the financial crisis.
“However, the leading indicators of trade in the first few months of 2017 are generally more positive, with trade growth of 2.4% estimated for this year. Trade is also expected to be given a boost by the implementation of the WTO’s Trade Facilitation Agreement (TFA), which entered into force earlier this year.”
