


Descartes which provides on-demand, software-as-a-service solutions focused on improving the productivity, security and sustainability of logistics-intensive businesses, published Global Shipping Report: China – US Trade Shift: Where Did the Market Share Go or Did It? evaluates how the market share of top imports from China into the US has changed over the last seven years.
Descartes’ analysis investigates the top 10 two-digit commodity categories (HS-2 digits) across a variety of industries, along with their top 10 Countries of Origin (CoOs) between 2016–2022.
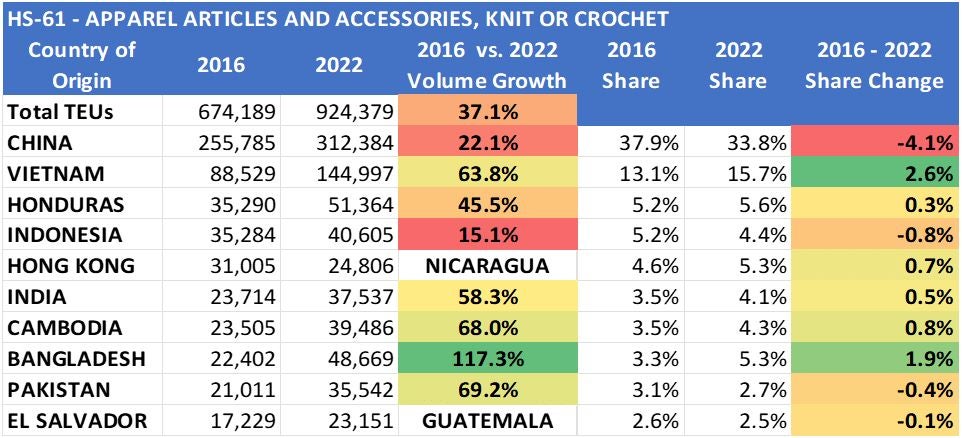
Looking specifically at the HS-61 (Apparel Articles And Accessories, Knit or Crochet) category, import volumes rose 37.1% between 2016 and 2022.
While imports from China increased 22.1%, its share decreased by 4.1% to 33.8% in the same period but is still twice as large as the second CoO, Vietnam.
Nicaragua & Guatemala displaced Hong Kong and El Salvador on the top 10 list.
Accelerated growth occurred for Vietnam and Bangladesh in 2021 and 2022.
“The analysis shows that China has been slowly losing its share of US container import volume but remains the dominant CoO for many of the top 10 commodity groups imported by the US, even as countries in South and Southeast Asia, such as Vietnam, India, Thailand and Indonesia, have quickly built capacity in a number of goods categories,” said Chris Jones, EVP Industry at Descartes. “Descartes’ report provides insight into the share of volume that has shifted away from China, where it went in terms of other country of origins (COOs) and how the story differs across the top commodity groups.”
To help importers understand the shifting trade landscape, Descartes analysed the top 10 two-digit commodity categories (HS-2 digits) and their top 10 COOs over the period of 2016–2022 to see whether China is losing market share and, if so, what countries are displacing it as a top US trading partner. The analysis paints a different picture depending upon the commodity group.
For example, for HS-94 (furniture, bedding, lighting, etc.), Chinese imports into the US grew 4.7% by volume in twenty-foot equivalent units (TEU) over the seven-year period, but its share shrunk by 17.3% (see Figure 1). The Chinese share was negatively affected by rising imports from a string of other countries, notably Vietnam, that collectively increased volume much more significantly.
Individually, these countries’ volumes are much smaller than China’s but the collective shift to them dampened China’s overall volume growth and pushed its market share into negative territory. This underscores that US businesses are learning to adopt a multi-country strategy sourcing strategy that still includes China.